Dubai's 2026 didn't unfold the way last year's finish suggested it would.
Coming off a second half of 2025 in which revenue per listing rose 25% year-over-year without any real growth in supply, the market carried real momentum into January. Rates kept climbing, revenue held its ground, and everything pointed to another strong year. Then, in late February, the outbreak of the Iran conflict brought UAE airspace closures and mass flight cancellations that landed squarely on top of what should have been peak spring travel weeks. March, April, and May all posted steep declines in occupancy and revenue, sharper than the same months a year earlier. By June, a full month after restrictions were lifted, the market had settled back into its 2025 rhythm almost exactly — supply, rates, occupancy, and revenue all landing within a few percentage points of where they stood twelve months prior.
At a Glance: Dubai Midyear STR Check-in (H1 2026)
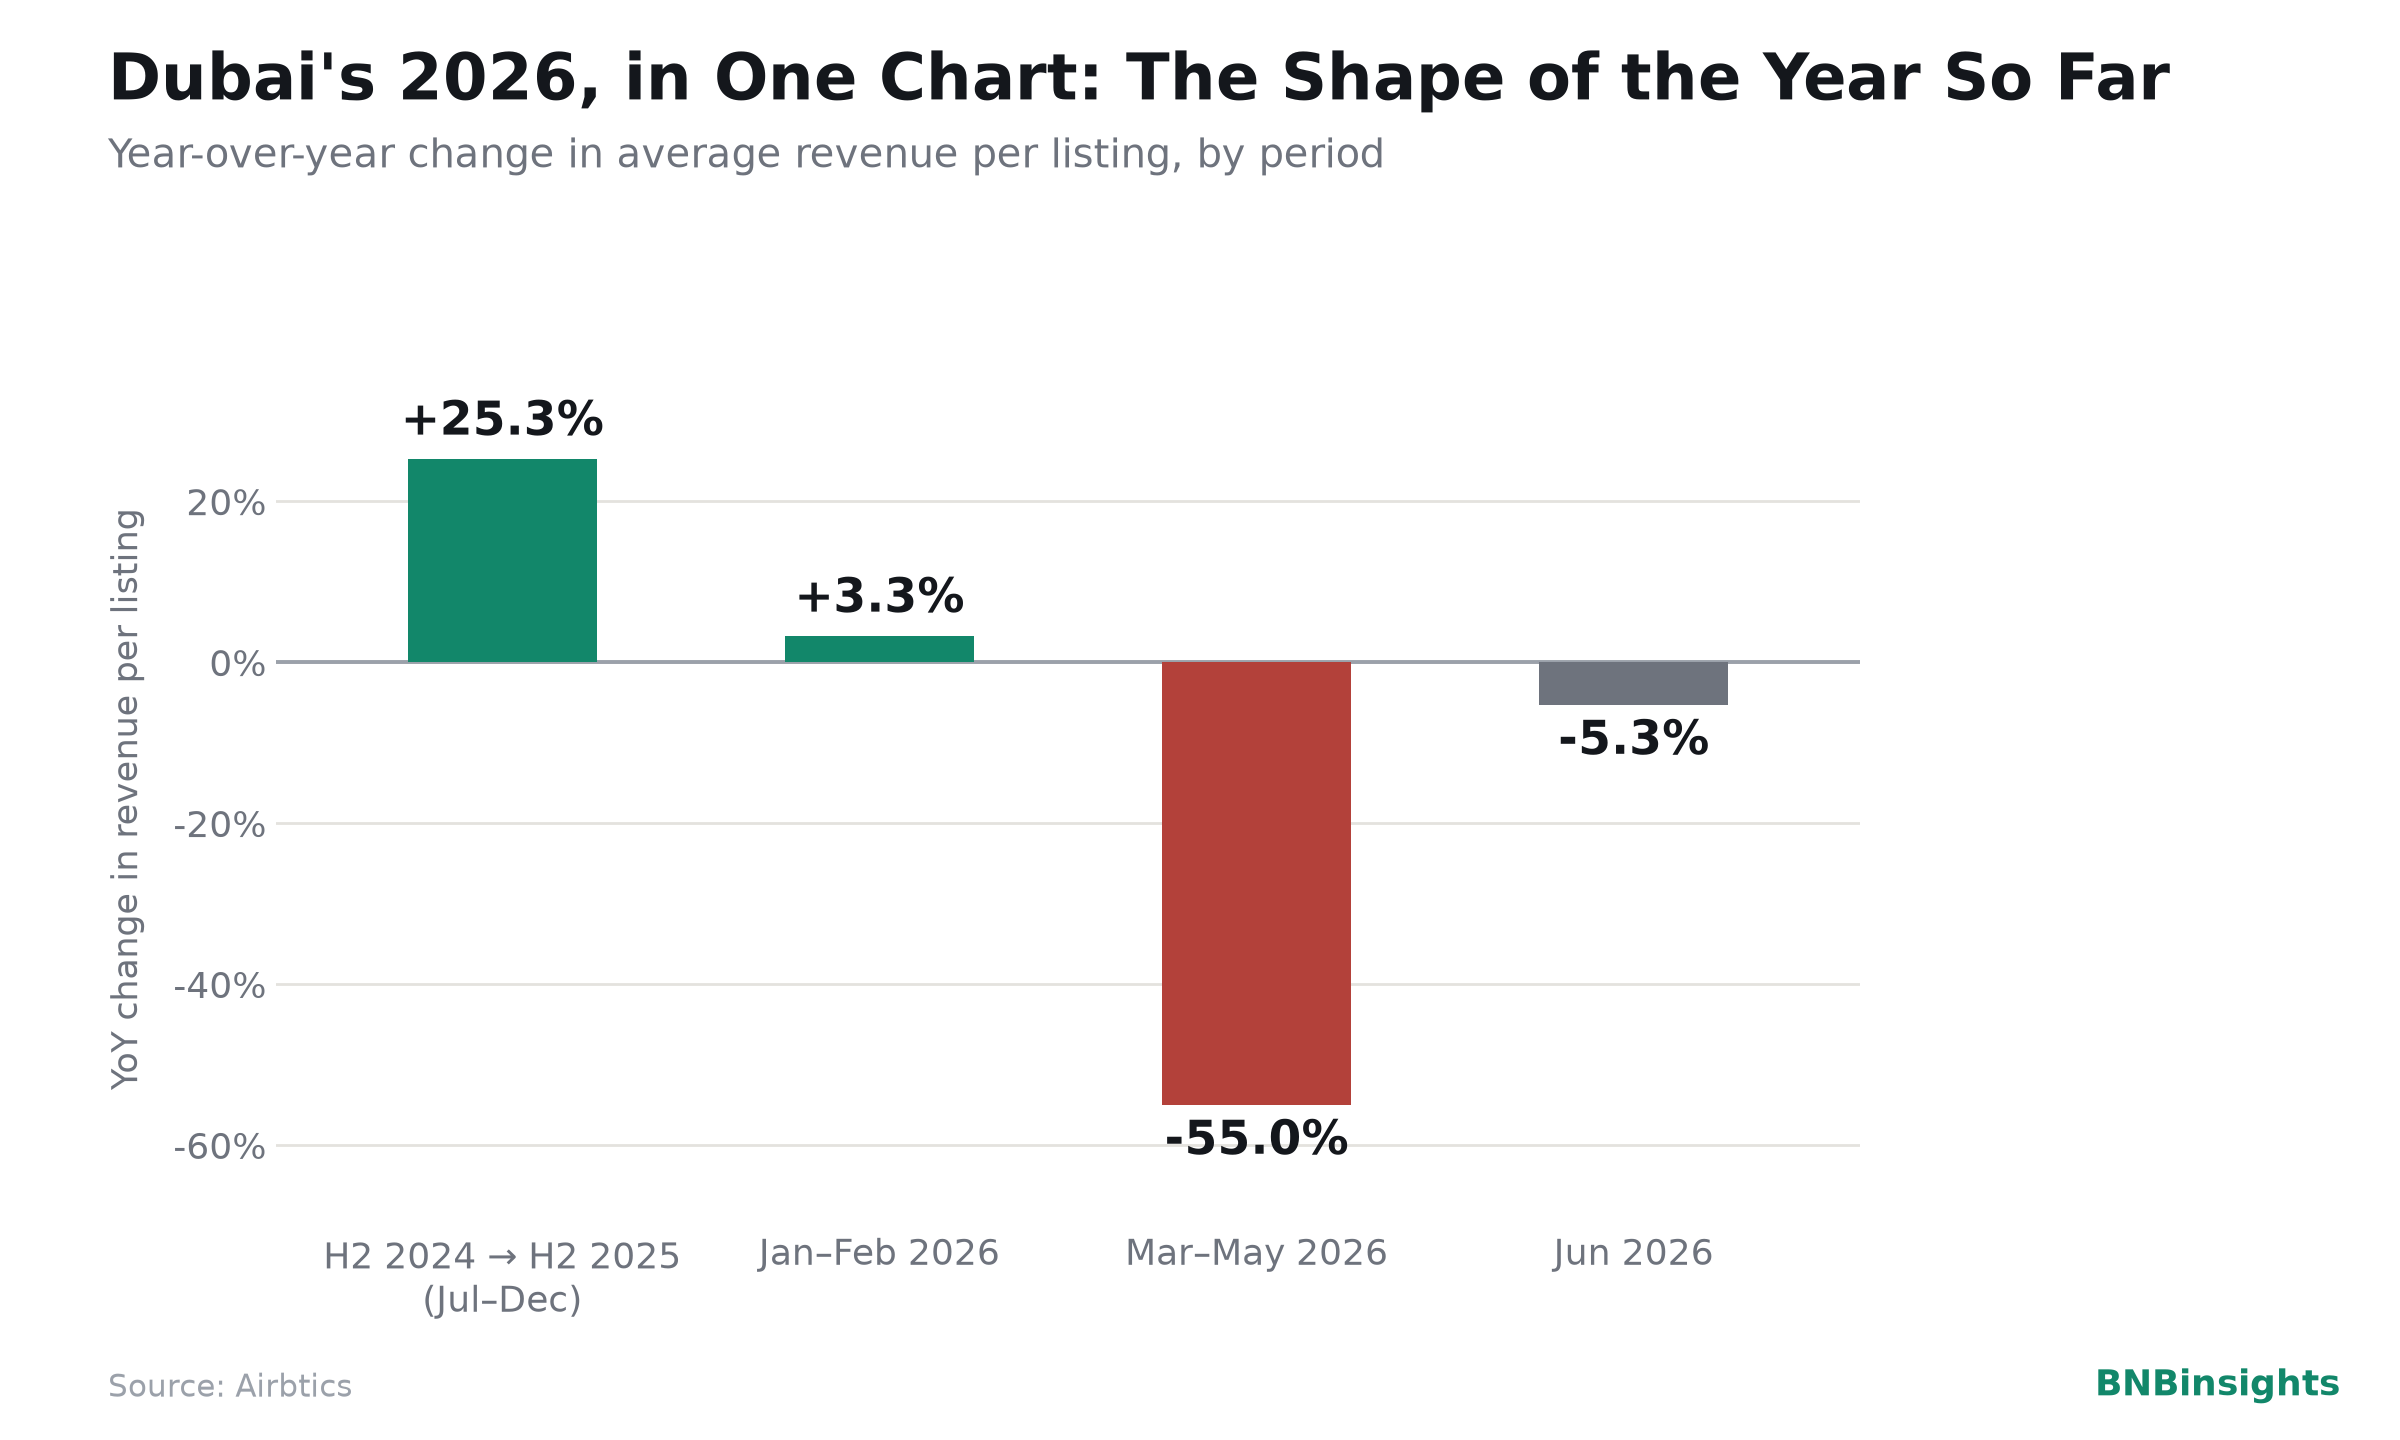
- Revenue per listing across the second half of 2025 grew 25% year-over-year (AED 78,752 to AED 98,694 across July–December) with supply essentially flat — a demand-led, not supply-led, record run.
- January and February 2026 extended that strength: average daily rate rose 21.5% and 10.2% year-over-year, though a 7.9% jump in active listings meant occupancy softened even as revenue held roughly flat to slightly up.
- March–May 2026 revenue per listing fell 55% year-over-year, a steeper drop than the equivalent stretch in 2025, as the Iran conflict's airspace closures and flight suspensions hit Dubai squarely in what should have been high season — and supply grew 24% into that same window.
- June 2026 reconverged with June 2025 almost exactly: occupancy flat at 64%, revenue down just 5.4%, and active listings within 7% of year-ago levels — a month after the UAE lifted all conflict-related air-traffic restrictions on May 3.
- Underneath the swings, hosts and property managers report a steady rise in longer-stay bookings, as more Dubai residents choose flexible short-term rentals over signing a full annual Ejari lease.
A Record Second Half of 2025 Set the Stage
Start with where the market was heading into 2026, because it explains why the slowdown that followed felt so jarring.
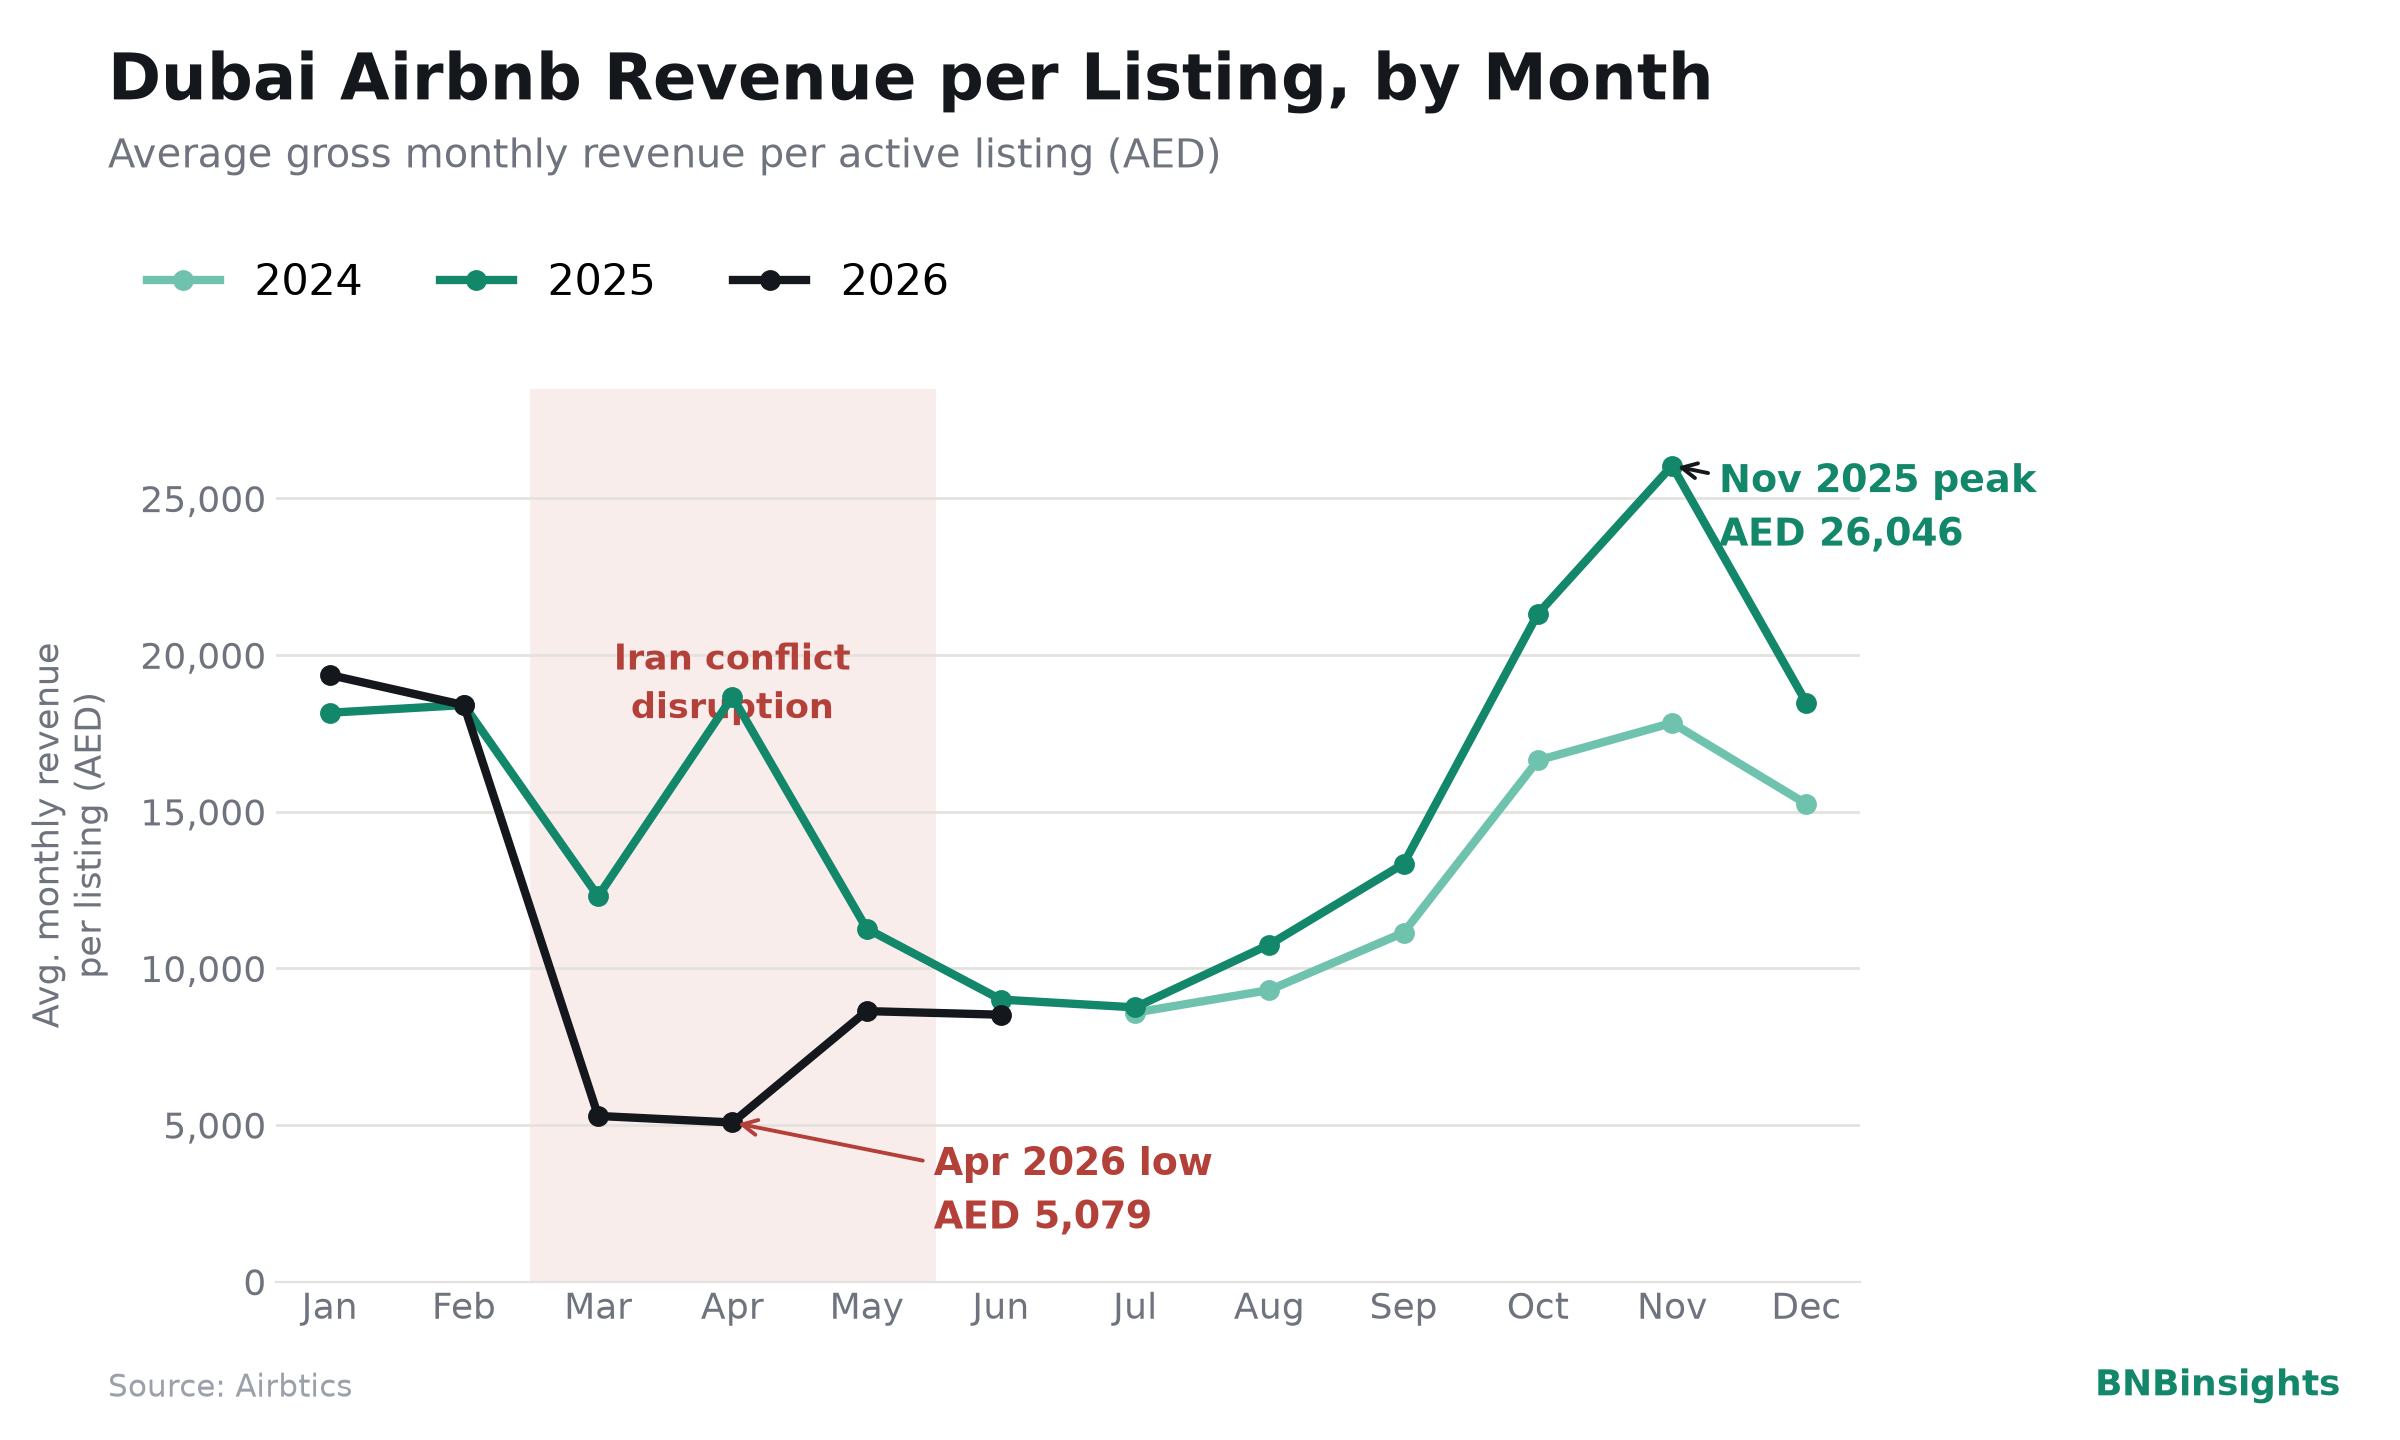
Revenue per listing climbed almost every month from September through November 2025, peaking at AED 26,046 in November — nearly triple the AED 9,003 the average listing brought in that June. Average daily rate followed the same arc, rising from AED 558 in September to AED 874 in November and AED 889 in December, a seasonal high for the entire 24-month dataset. Occupancy told the same story: 96% in November 2025, the strongest single month on record in this dataset, alongside a matching 96% peak the previous April.
What makes the run notable is what didn't move: supply. Total revenue per listing across July–December 2025 rose 25% year-over-year, from AED 78,752 to AED 98,694, while the listing count across those same six months was essentially flat (-0.3%). Dubai's host base didn't need to expand to capture the gains — existing listings simply earned more, filled more often, at higher rates. That's a demand-led market, and by December 2025, active listings had climbed to 17,410, the highest point across the entire two-year dataset, as hosts moved to capture the winter peak rather than lead it.
January–February 2026: Momentum Meets More Competition
The new year opened in line with that strength, at least on rate. Average daily rate rose 21.5% year-over-year in January (AED 702 to AED 852) and 10.2% in February (AED 687 to AED 757). Revenue per listing followed, up 6.7% in January and essentially flat in February.
But the composition of that growth was already shifting. Active listings rose 10.5% in January and 5.0% in February year-over-year, and occupancy came under real pressure as a result — down 11 percentage points in January (83% to 72%) and 9 points in February (86% to 77%). Rate growth outran booking frequency: the market absorbed more competition and higher prices at the same time, and revenue per listing held up almost entirely because rates did the work occupancy couldn't. It's a pattern familiar from other mature short-term rental markets working through a supply upcycle — pricing power carries the headline number even as the booking rate underneath it softens.
March–May 2026: The Iran Conflict Shock
This is where 2026 broke from script.
In late February 2026, the outbreak of the Iran conflict — following U.S. and Israeli strikes and the ensuing Strait of Hormuz crisis — brought the UAE's aviation sector to a near-standstill. The UAE declared a temporary, partial closure of its airspace, Emirates and flydubai halted operations, and Etihad suspended departures from Abu Dhabi. Regional carriers cancelled more than 11,000 flights in the days that followed, and flydubai's initial Dubai flight suspension, first set to lift March 3, was repeatedly extended. A second shock hit on March 16, when a drone-related incident near Dubai's airport triggered another temporary shutdown. Restrictions eased gradually through April, and the UAE didn't lift all conflict-related air-traffic restrictions until May 3.
That timeline maps almost exactly onto the booking data:
- March 2026 occupancy fell to 27%, down 43 percentage points from March 2025's 70% — a 61% relative decline. Revenue per listing fell 57%, from AED 12,300 to AED 5,288.
- April 2026 occupancy dropped to 32%, down 64 points from April 2025's exceptional 96%. Revenue per listing fell 73%, from AED 18,671 to AED 5,079 — a month still operating under partial restrictions.
- May 2026 was comparatively mild — occupancy down 8 points (70% to 62%), revenue down 23% (AED 11,270 to AED 8,635) — consistent with a market recovering in real time as the UAE lifted its remaining restrictions on May 3.
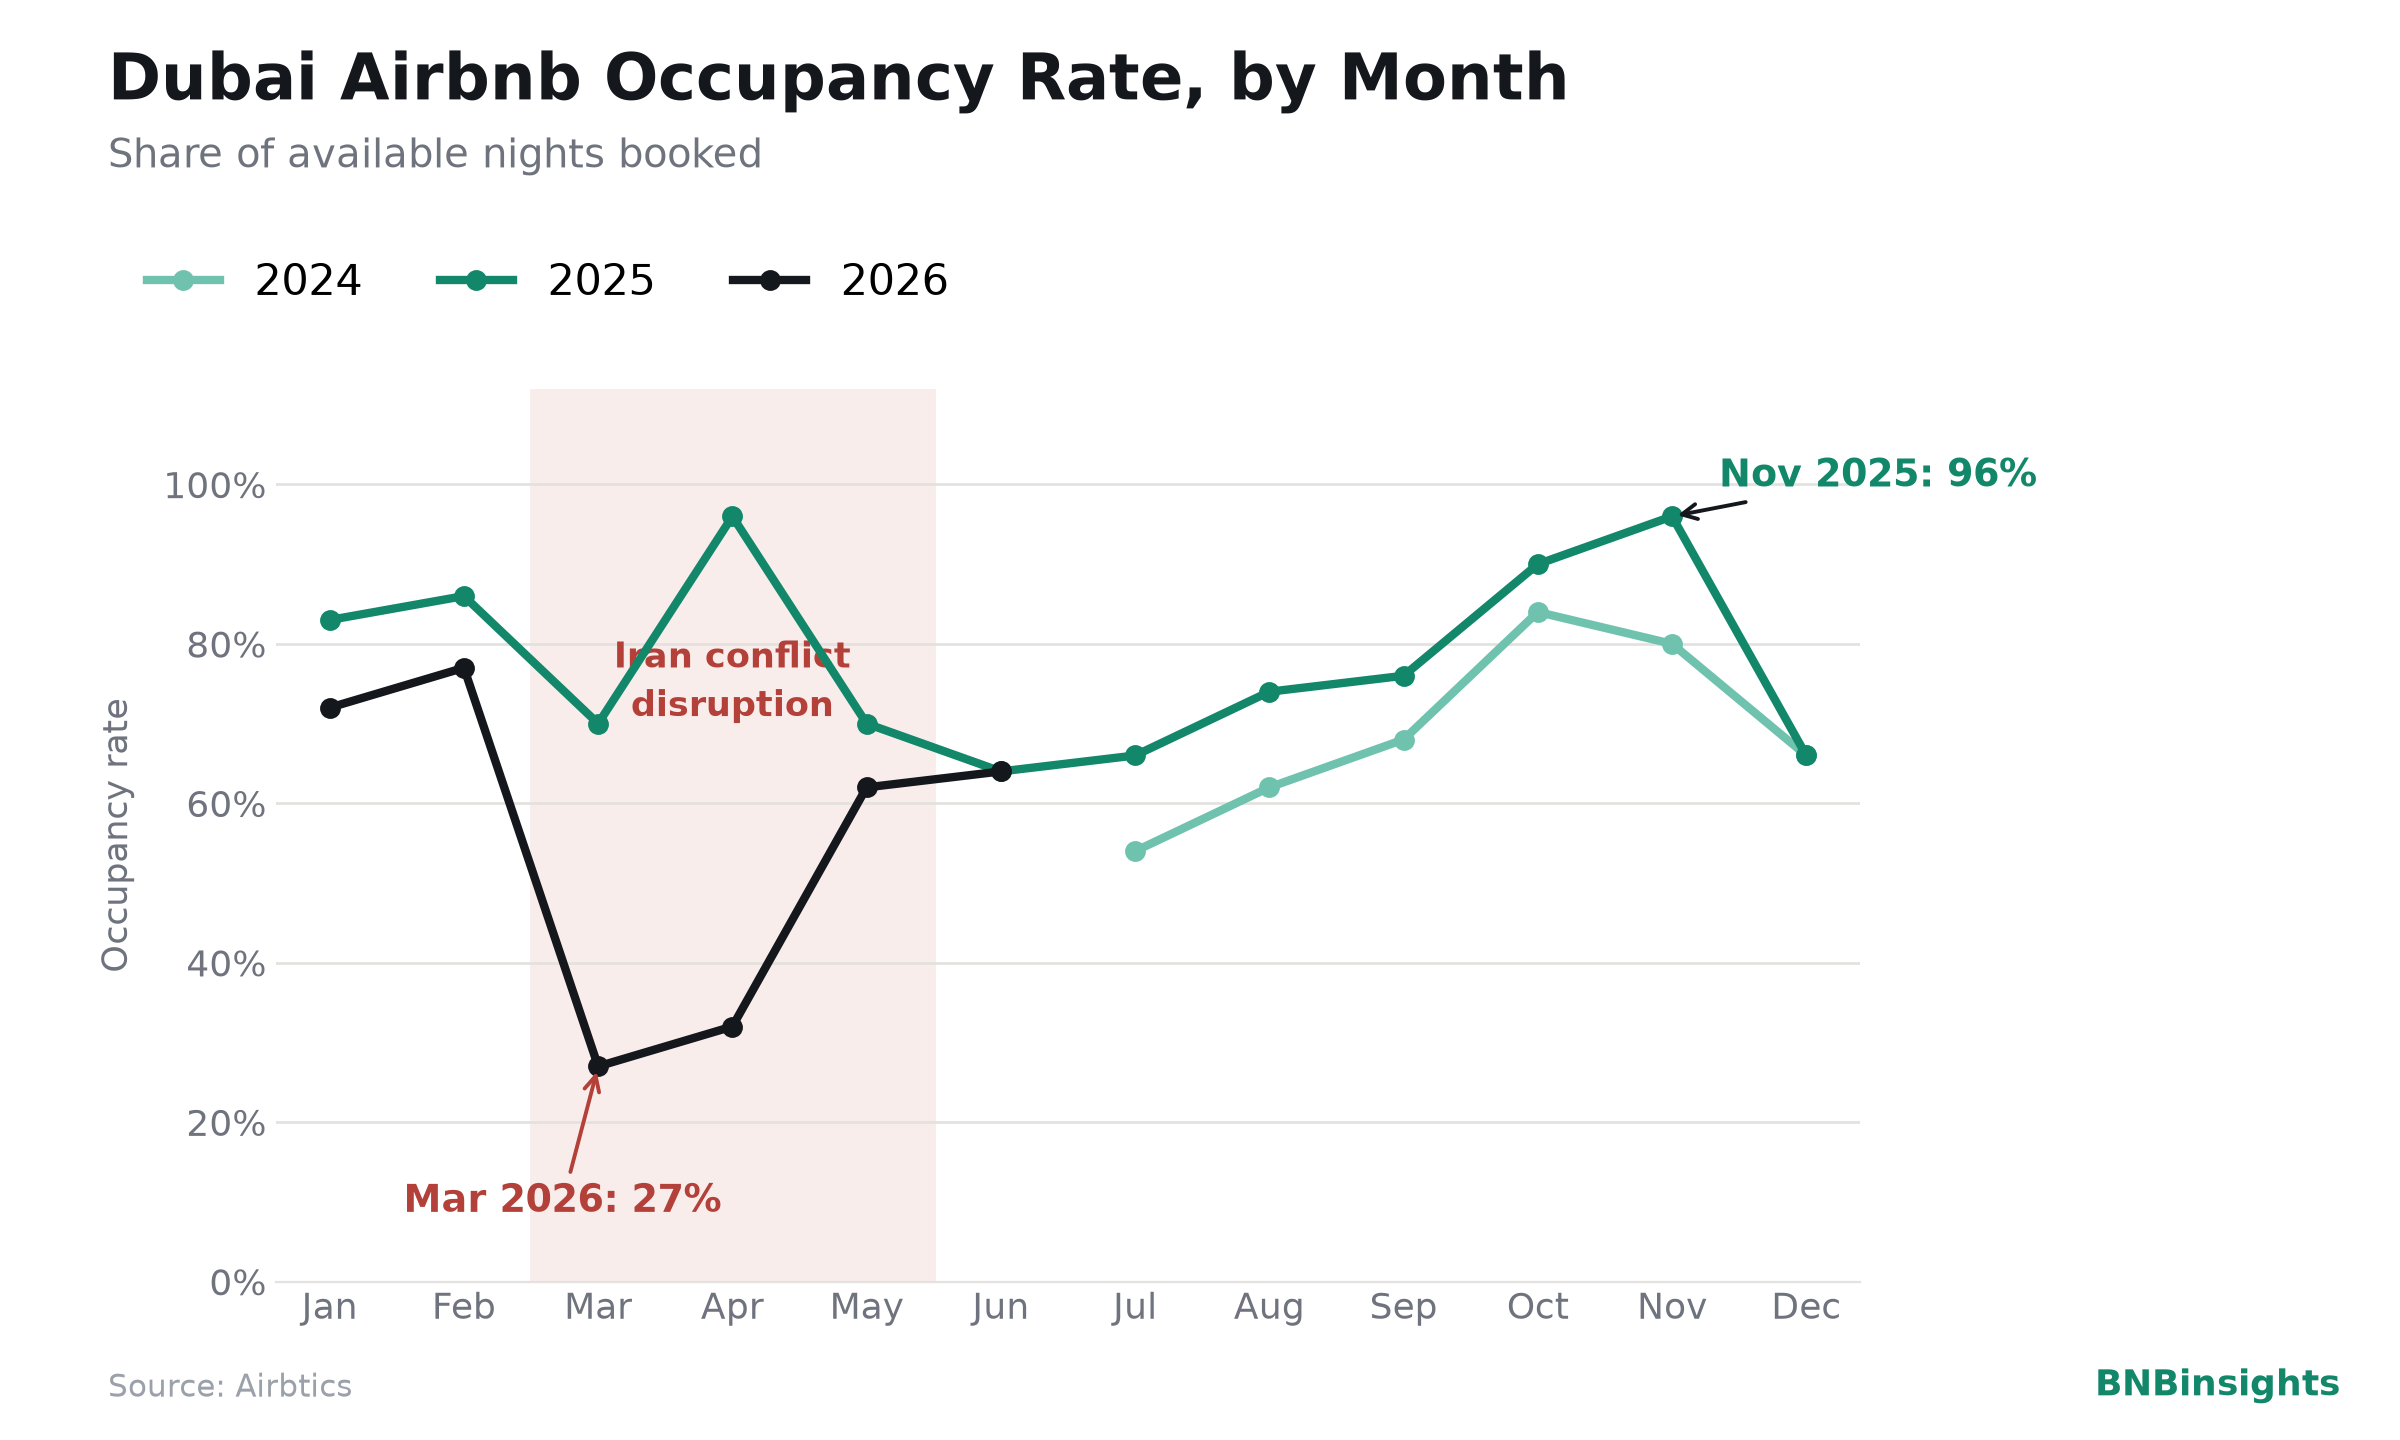
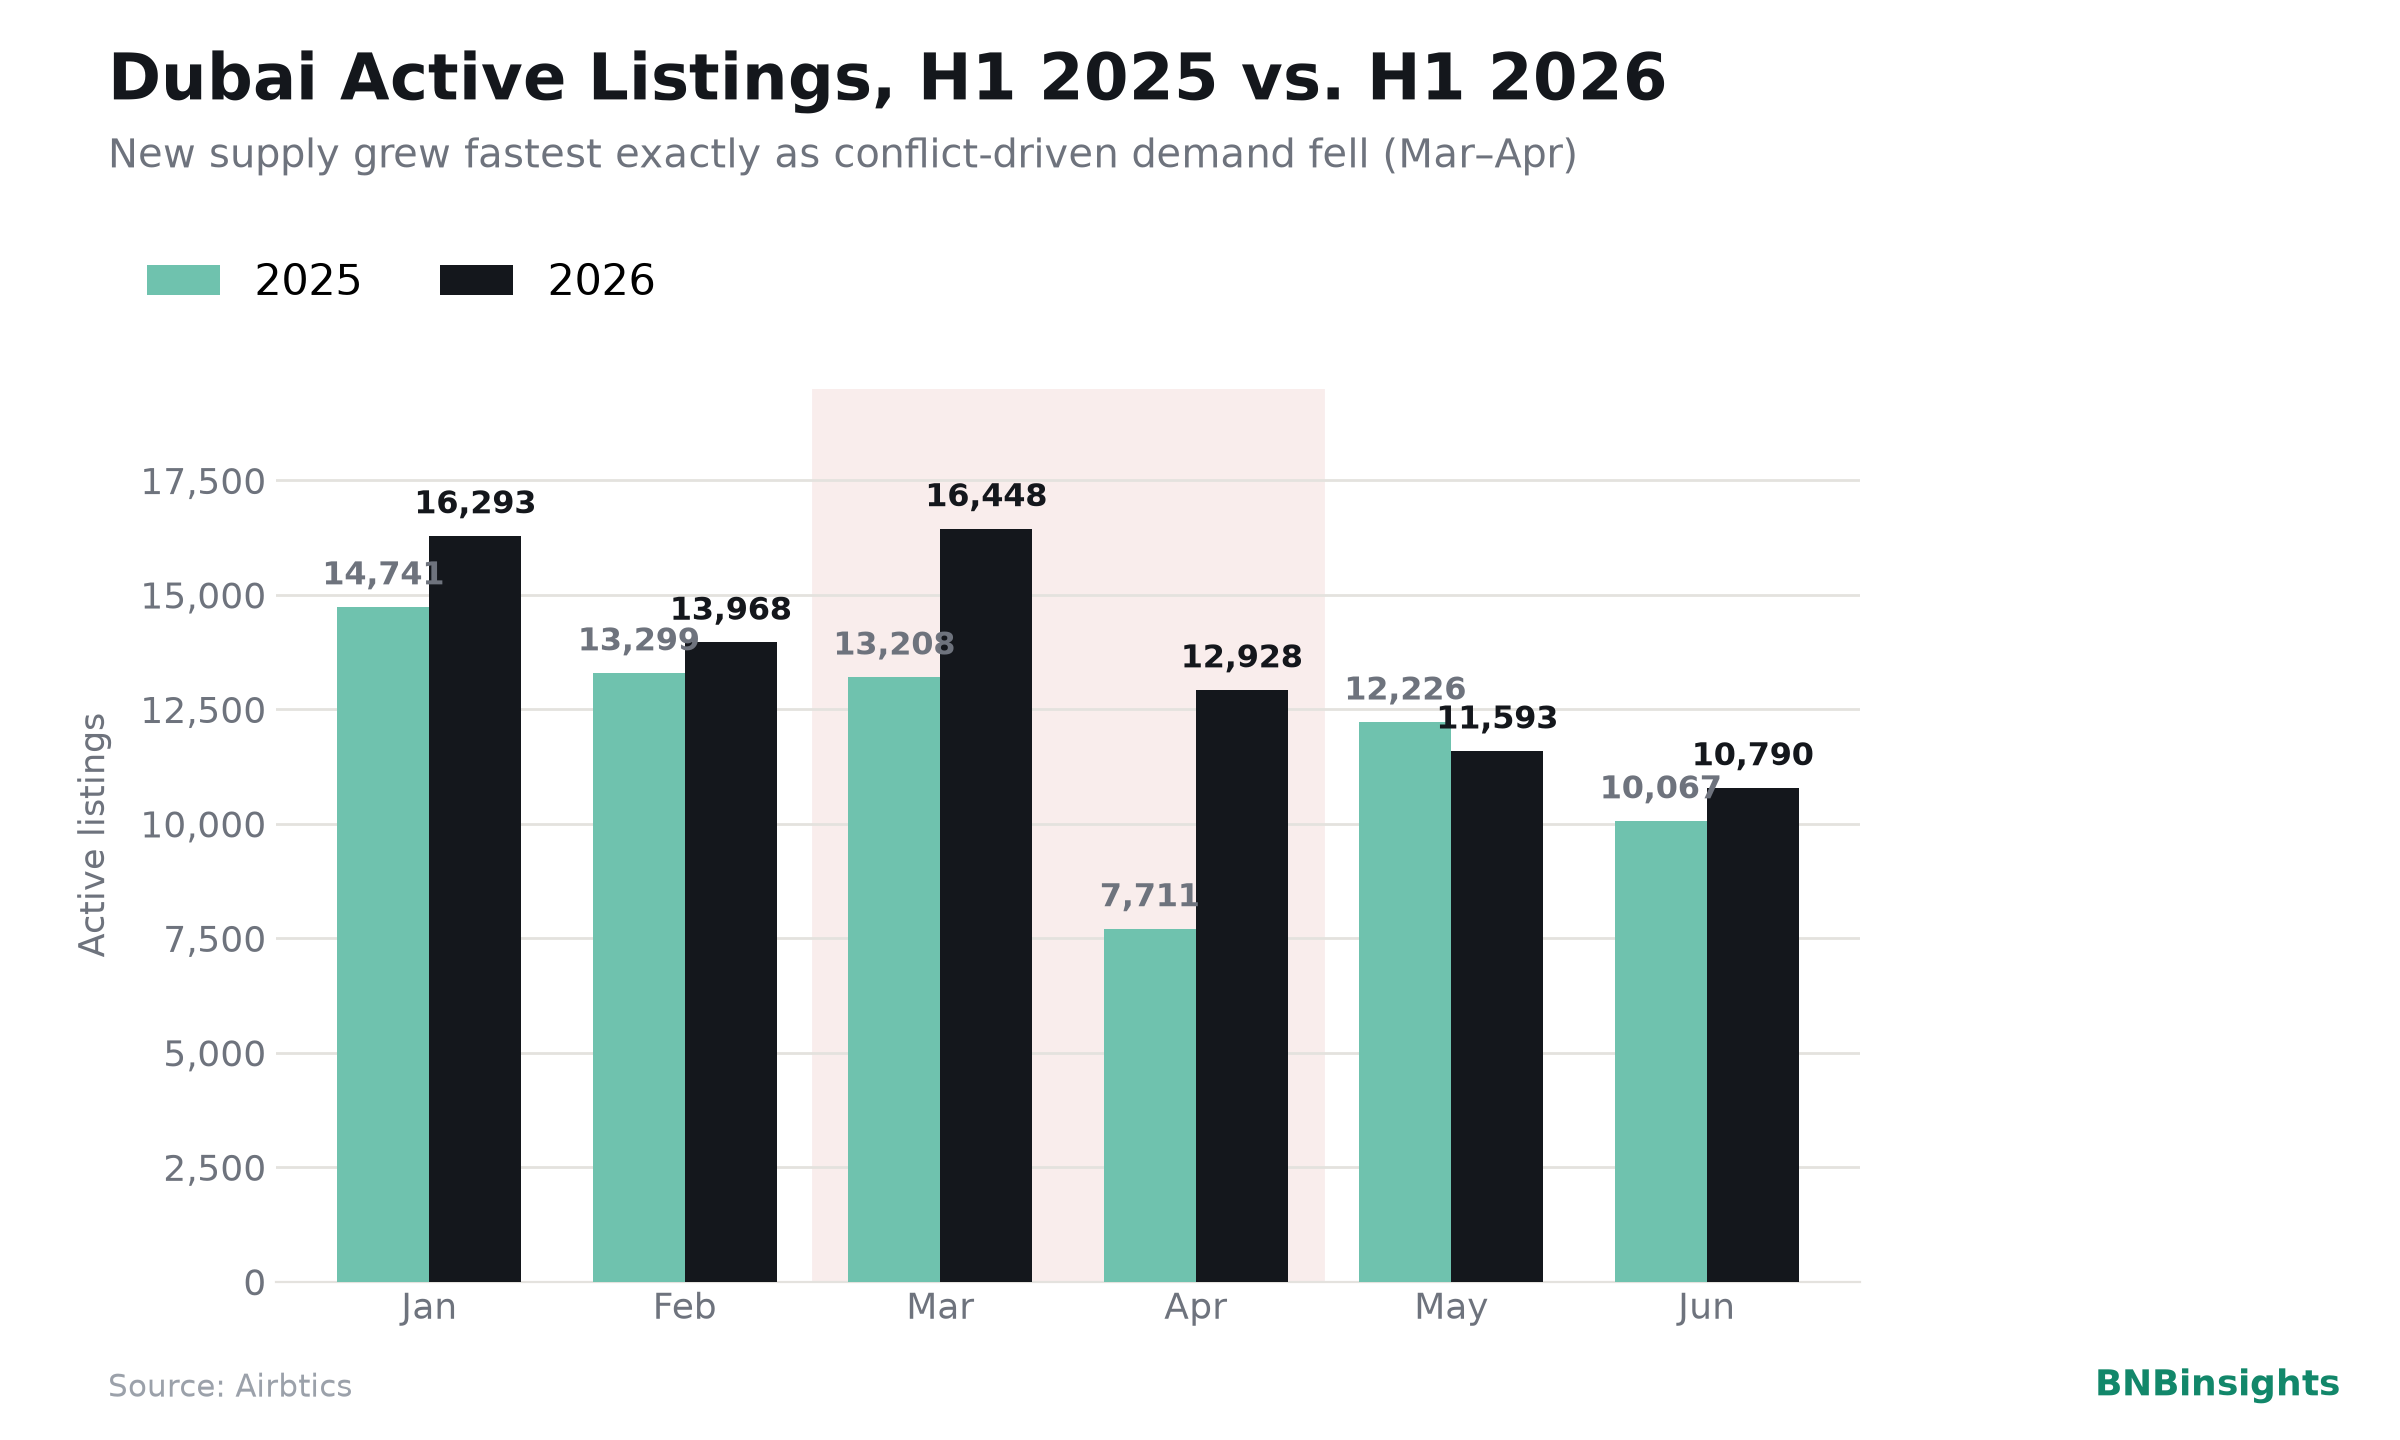
Worth flagging separately: part of the year-over-year gap is a base-effect distortion, not conflict impact. Active listings in April 2025 dropped sharply to just 7,711, well below the roughly 12,000–13,000 active in the surrounding months — thin enough that it likely concentrated bookings into a smaller pool of listings and inflated April 2025's per-listing occupancy and revenue figures. April 2026's listing count of 12,928 is much closer to the market's underlying norm, which mechanically pulls per-listing metrics down even before the conflict's impact is factored in. Layer both effects together — a genuine demand shock and a much thinner comparison base — and April 2026's 73% revenue decline overstates how much of the drop was organic.
The supply side made the disruption harder to absorb, too. Active listings rose 24.5% year-over-year in March 2026 and 67.7% in April, meaning more competing listings landed directly on top of the conflict's weakest demand weeks — a supply build that, unlike the disciplined growth of late 2025, arrived at exactly the wrong moment.
June 2026: Back to Trend
By June, the market had largely reset. Occupancy matched June 2025 exactly at 64%. Average daily rate was down a modest 5.8% (AED 441 to AED 415), and revenue per listing was down just 5.4% (AED 9,003 to AED 8,520) — essentially on par with the prior year once rounding is accounted for. Active listings rose 7.2% (10,067 to 10,790), roughly in line with the market's underlying growth trend rather than the outsized swings seen in the spring months.
In short: after three months of a much wider gap than the year before, Dubai's short-term rental market didn't just stabilize in June — it converged back onto the same seasonal curve as 2025, on every metric at once.
Guest Trend: Locals Are Trading Ejari for Flexibility
The monthly topline numbers capture booking volume and pricing, but they don't capture length of stay — and that's where hosts and property managers are seeing the more interesting shift this year. A growing share of Dubai bookings, by host accounts, are coming from residents choosing month-to-month or multi-week short-term rentals instead of signing a standard annual Ejari lease.
The logic is straightforward: Ejari contracts lock a tenant in for twelve months with limited flexibility and typically require post-dated cheques covering the full year, while a furnished short-term rental offers month-to-month flexibility, no long-term commitment, and utilities and Wi-Fi already bundled in — a meaningful draw as more residents relocate for shorter work assignments or want to test a neighbourhood before committing to a lease. This is a demand source distinct from tourism, and it behaves differently across the calendar: resident-driven bookings don't disappear during Ramadan or the summer heat the way tourist demand does, which may help explain why occupancy in the market's softest months — 62% in May, 64% in June — never approached true off-season lows despite steep drops in the tourist-driven ADR and revenue figures. It's a trend worth watching through the second half of the year as a structural source of demand underneath the seasonal swings.
The Bottom Line: What This Means for the Rest of 2026
Dubai's 2026 has been a market of two very different stories stitched together by an external shock. The fundamentals coming out of 2025 were genuinely strong — record revenue, rate discipline, and demand outpacing supply through the back half of the year. Nothing in the March–May data suggests that underlying strength reversed; it suggests the Iran conflict's airspace closures and flight suspensions temporarily froze demand in months that are usually dependable, and that a wave of new listings landed in the market at the same time, amplifying the swing on both sides.
For hosts, the practical read is that this year's dip was event-driven rather than structural, and the June data backs that up: once restrictions lifted on May 3, the market didn't just stabilize, it reconverged with 2025 within a month. For anyone benchmarking performance against last year, April in particular deserves a caveat given how thin the 2025 comparison base was. And with June already back in line with 2025, the second half of the year — assuming it follows the same seasonal pattern that drove November 2025 to a record AED 26,046 in revenue per listing — looks well positioned to close out 2026 on a stronger note than the spring numbers alone would suggest, provided the region stays calm.
Common questions
Why did Dubai's short-term rental market slow down so much in Q2 2026?
Has the market recovered by summer 2026?
What's driving longer-stay bookings in Dubai?
What should hosts and investors watch for in the second half of 2026?
Track your portfolio against every month, not just the headline number
BNBinsights shows your real occupancy, ADR, RevPAR, and revenue by unit, month over month — so you see a shift like this one in your own data as it happens, not months later in a report.
Join the waitlist